
 Active Transportation
 Public Transit
 Electric Transportation
Washington’s Climate Commitment
In the Evergreen State, we value clean air, healthy communities, and forward progress. That’s why we lead the nation in natural beauty, quality of life, and clean energy. Because of the Climate Commitment Act, a Cap-and-Invest program to reduce carbon pollution, it’s no longer free to pollute in Washington. The state’s biggest polluters are funding investments in a clean, prosperous future.
Without Cap-and-Invest funding, the state’s ability to address pollution reduction, increase resilience, improve public health, and support natural and working lands would be greatly reduced. Our Climate Commitment would remain but without the Action needed to rise to the challenge for a cleaner and more prosperous Washington. Decreased Climate Commitment Act investments or those repurposed away from the program’s intent would also leave Washington communities with fewer economic benefits, putting more pressure on less cost-effective regulatory strategies to meet state climate goals. Or miss those climate goals, and the associated benefits, altogether.
The Climate Commitment Act survived a recent challenge at the ballot box, Initiative 2117, by a resounding margin of 62% to 38%, including 24 out of 39 counties voting to sustain the program. The counties voting against the Initiative (to sustain the Climate Commitment Act) contain nearly 90% of Washington’s population.
However, the Climate Commitment Act and the benefits of its investments remain vulnerable to weakening or reversal, including through legislative or regulatory actions. Weakening the program or the principles of investments made with the revenue raised from large polluters would jeopardize plans for boat and vehicle electrification, wildfire prevention and recovery, salmon and other habitat improvements, improved air quality in our most heavily polluted communities, expanded transit options, and more. Federal funds and private investment could be redirected to other states, and we’d extend our dependence on price-volatile and polluting fossil fuels.
Uncovering Investments in Every County
Washington’s Climate Commitments can be explored through our interactive educational mapping tool that offers clarity, transparency, and detailed information about state-directed investments. Climate Commitment Act investments encourage innovation, create new jobs, safeguard natural resources, improve air quality, accelerate the adoption of lower fuel cost technologies, revive and clean up our aging ferry fleet, improve the mobility of people and goods, strengthen a cleaner power grid, and much more.
This map, inspired by the California Climate Investments map, lets you see how the Climate Commitment Act is putting shovels into the ground across this state, leading Washington towards a cleaner and more prosperous future.
Understanding the breadth of Washington’s Climate Commitments gives users the opportunity to explore where the state is investing Climate Commitment Act revenues and better equips the public to assess and provide feedback on the use of state revenue to achieve the stated aims of this market-based, long-term pollution reduction, clean energy innovation, and climate resilience program.
Investments are organized both as a map and a downloadable database, enabling additional independent analysis. The mapping tool incorporates some investments from the interrelated seventeen-billion dollar Transportation budget known as Move Ahead Washington (which receives $5.2 billion directly from the Climate Commitment Act over sixteen years). What investments will you uncover as you explore the map and database?
About the Climate Commitment Act
The Climate Commitment Act (CCA) is Washington’s Cap-and-Invest program which caps the majority of carbon pollution in the state and invests money raised directly from large polluters towards a variety of programs spread across the state via seven investment accounts. It’s the central strategy for the state to reduce its carbon pollution while improving air quality in Washington’s highest-risk communities. The Climate Commitment Act is designed to ensure large pollution sources meet an emissions reduction course to net-zero by 2050 set in state statute.
The Cap on emissions is a proven approach and is the CCA’s primary lever for emissions reductions: around one hundred large emitters and fuel suppliers, collectively responsible for nearly three-quarters of the state’s greenhouse gas emissions, finding the most economically efficient approaches to reduce their pollution.
These investments deepen the reduction of both carbon and other key air quality pollutants while making sure the benefits of a transition to a cleaner and more prosperous future are accessible to all. They also help our communities, industries, and wildlife become healthier, more resilient, and more innovative.
Map Version and Data Download
Map Version: RoR-02-25 (updated: 2/26/25)
As funded programs turn into awarded projects, we will update the map. Notice something missing or inaccurate? Need technical assistance? Have a suggestion to improve the tool? We welcome your feedback: ClimateCommitment@cleanprosperousinstitute.org.
User guides on navigating the map and data tables as well as additional background and definitions can be found in the menu at the top of the page. To download the complete dataset as a spreadsheet, click here. For more summary information and graphics about the dataset, click here.
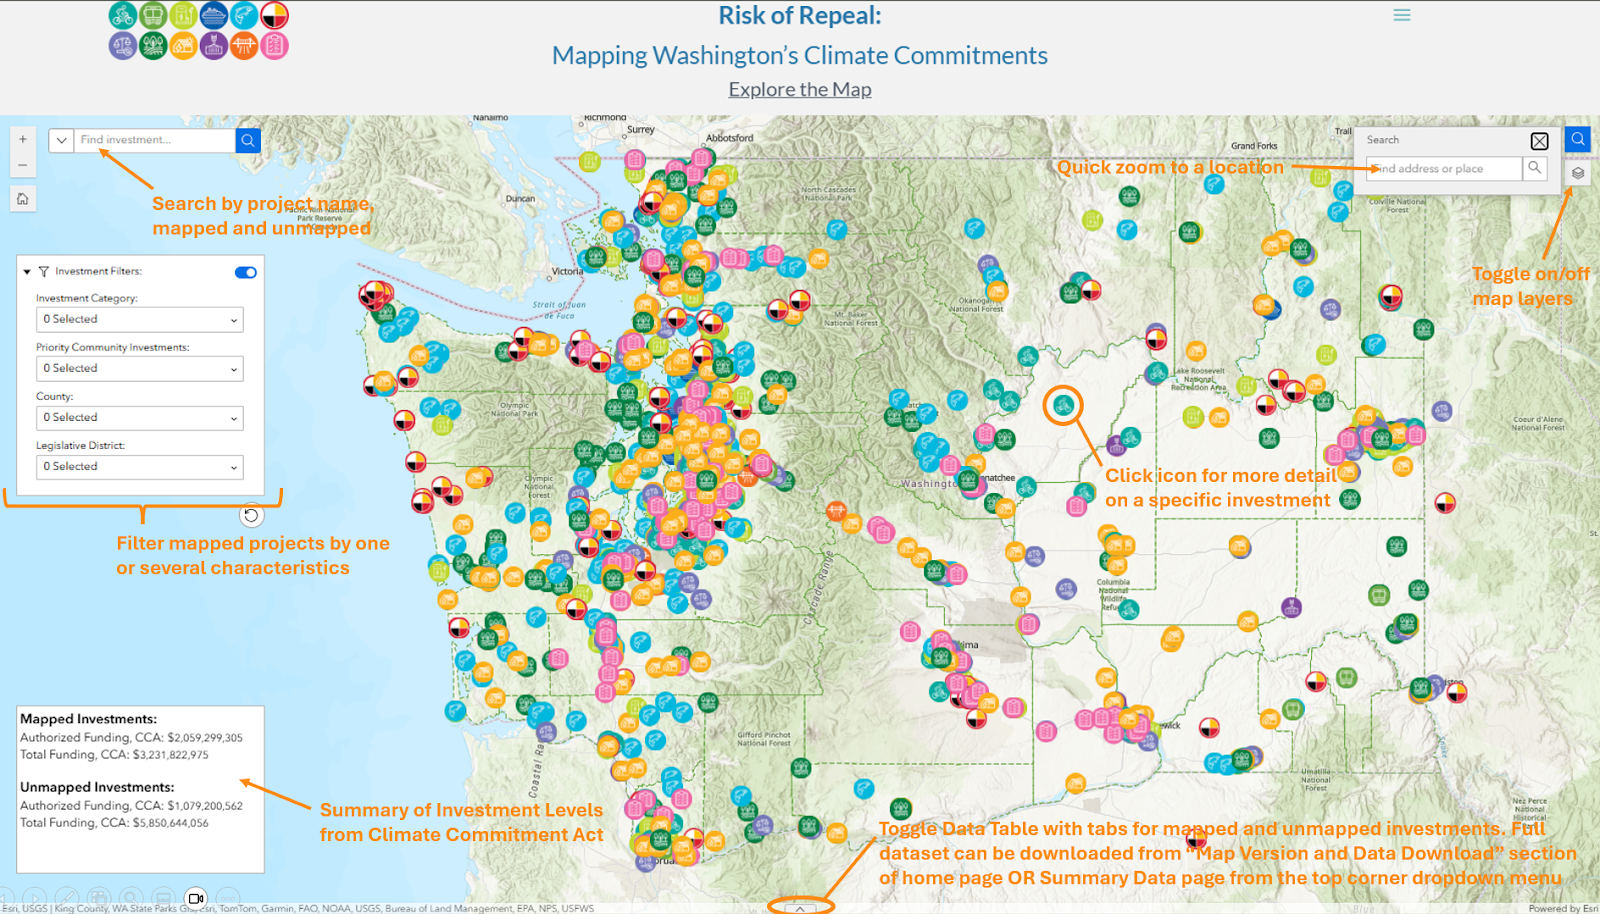
Map Quick Guide Diagram

Map Glossary
Investment Categories
Active Transportation: Projects focused on improved walking and biking access. The primary funding account for this category is the Climate Active Transportation Account within the Move Ahead Washington transportation budget.

Buildings, Innovation, and Clean Energy: A range of decarbonization projects focused on efficiency, renewables, and reduced fossil fuel consumption that Includes buildings, power sector, and industrial or hard-to-decarbonize sector investments.
Electric Transportation: Non-transit, on-road focused investments in electric vehicle charging and electric vehicles.

Environmental Justice Communities: Investments with an intentional and direct focus on improving Environmental Justice process and outcomes.
Ferries: Projects focused on capital costs of electrifying the Washington State Ferry system and some passenger ferry routes.

Fish Barrier and Habitat: Projects intended primarily to improve salmon or other fish access and habitat improvement.

Freight and Facilities: Projects focused on port or rail activities and the movement of goods across or to and from the state.

Natural and Working Lands: Agricultural, wildfire, and land conservation projects, not including those that are primarily for fish habitat.

Planning and Implementation: Climate Commitment Act and broad programmatic planning and implementation efforts, including general staffing. Planning efforts directly tied to investments or outcomes that fit in other investment categories may be assigned to those categories.
Public Transit: Projects that address ridership and fares, expanded or enhanced service, and capital projects for buses and bus infrastructure. Transit electrification efforts are shown as Public Transit investments and not Electric Transportation. The primary funding account for this category is the Climate Transit Programs Account within the Move Ahead Washington transportation budget.
Roads and Bridges: Includes investments from the broader Move Ahead Washington Transportation budget which received roughly 30% of its funding from the Climate Commitment Act.

Tribal-Led: Investments where a project lead or project partner is a Tribal government or entity. This icon is based on a Tribal logo used for certain work programs of the US EPA.
Prioritized Community Investments
The Climate Commitment Act includes two categories of priority community investments that are emphasized for certain percentage thresholds of total investments made with cap-and-invest revenue. More detail can be found in our Background and Details as well as the law itself: RCW 70A.65.230. Through this database, both the investments directed at “direct and meaningful benefits to vulnerable populations within the boundaries of overburdened communities” (35% minimum, 40% goal) and, within these investment totals, a 10% share for “ programs, activities, or projects formally supported by a resolution of an Indian tribe, with priority given to otherwise qualifying projects directly administered or proposed by an Indian tribe” are compiled and tracked.
We note two important details about this filter:
- The definitions of what qualifies towards these investment minimums are incomplete. We expect some movement both in and out as the criteria are clarified and locations of future investments become clearer.
- Some investments are expected to provide a share between none and all toward priority communities, which is particularly true in the broader “unmapped” programs. Our highest-level, summed total presented on the mapping tool itself does not account for these partial allocations. Therefore, CCA investments as reported in that summary data may not be accurate if directly used to draw conclusions about funding shares.
Funding Amounts - Authorized or Total
Authorized funding is approved funding through the current biennium. Authorized funding does not include planned future spending or any extension of funding for “ongoing” projects in the operating budget.
Total funding includes investment funding from any stage of the project life. While some operating budget funding is indicated as “ongoing” we do not include any additional planned funding in this database unless the ongoing funding amounts are specified.
Please note that funding totals update with filters for the mapped projects but not for the unmapped projects. Unmapped projects can be filtered, including for certain broader categories, via the search bar. To filter for unmapped projects, you will need to download the complete dataset and apply your own filters. The Clean and Prosperous Institute research team may be able to assist with some analysis upon request.
Map Layers
Our map offers the ability to toggle certain view layers on and off on the map. These include:
- Environmental Health Disparities Map Rank 9 or 10: These meet the definition of highly-impacted communities as defined in the Environmental Health Disparities Map, and are therefore considered by the Climate Commitment Act to be “vulnerable populations within the boundaries of overburdened communities”.
- Ecology Improving Air Quality Communities: These 16 communities were identified by Washington Department Ecology as part of the Improving Air Quality in Overburdened Communities initiative: “Currently, we have identified 16 overburdened communities highly impacted by air pollution, with more to come following Tribal consultation. These communities represent more than 1.2 million people, or about 15.5% of the population of Washington.”
- Counties: Borders for the 39 counties within Washington State.
- Tribal Reservations: Provide reservation borders for federally recognized tribal nations located within the contiguous state and international borders of Washington State. This source for this layer is the ESRI US Federal Database: “This feature layer, utilizing National Geospatial Data Asset (NGDA) data from the U.S. Census Bureau, displays federally recognized American Indian reservations.”
- Overburdened Communities of Washington State: A map based on 2010 Census Tracts published by the state of Washington on May 30, 2024:
“The Overburdened Communities of Washington State dataset merges several critical and currently available data sources to identify census tracts where vulnerable populations face cumulative environmental and health impacts. This dataset integrates 2010 census tracts ranked 9 or 10 by the Washington Environmental Health Disparities (EHD) Map, tracts identified as “disadvantaged” by the federal Climate and Economic Justice Screening Tool (CEJST), and tracts overlapping with Tribal reservations (as recognized by the Bureau of Indian Affairs). The dataset covers urban, suburban, and rural areas, and varying in population and area size. These data support the identification of fund allocation under the CCA and HEAL Act, aiming to ensure equitable expenditures of funds towards environmental benefits and reduction of burdens in these critical areas. The dataset will be updated annually but is static between updates.”
Acknowledgements
The mapping tool was created by Zac Pinard, GIS Specialist. A team of students from the University of Washington, under the guidance of Fred Pursell at the University of Washington Foster School of Business, provided additional research and design assistance. Clean and Prosperous Institute would like to thank those students for their contributions: Chikita Nigam, Dylan Fournier, Jade Cheatham, Madison Calma, and Megan Hassi.